Low-Cost, High-Impact: How Communities Can Monitor Their Water Futures
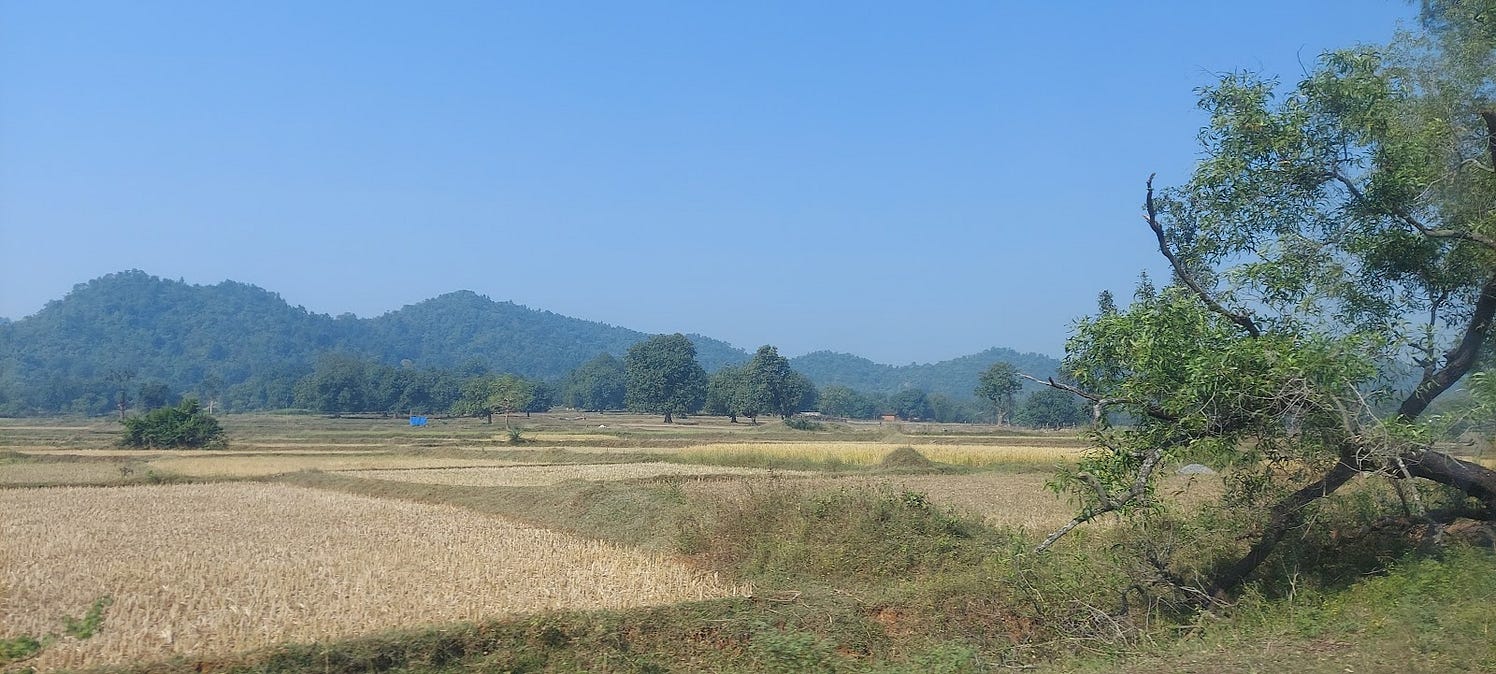
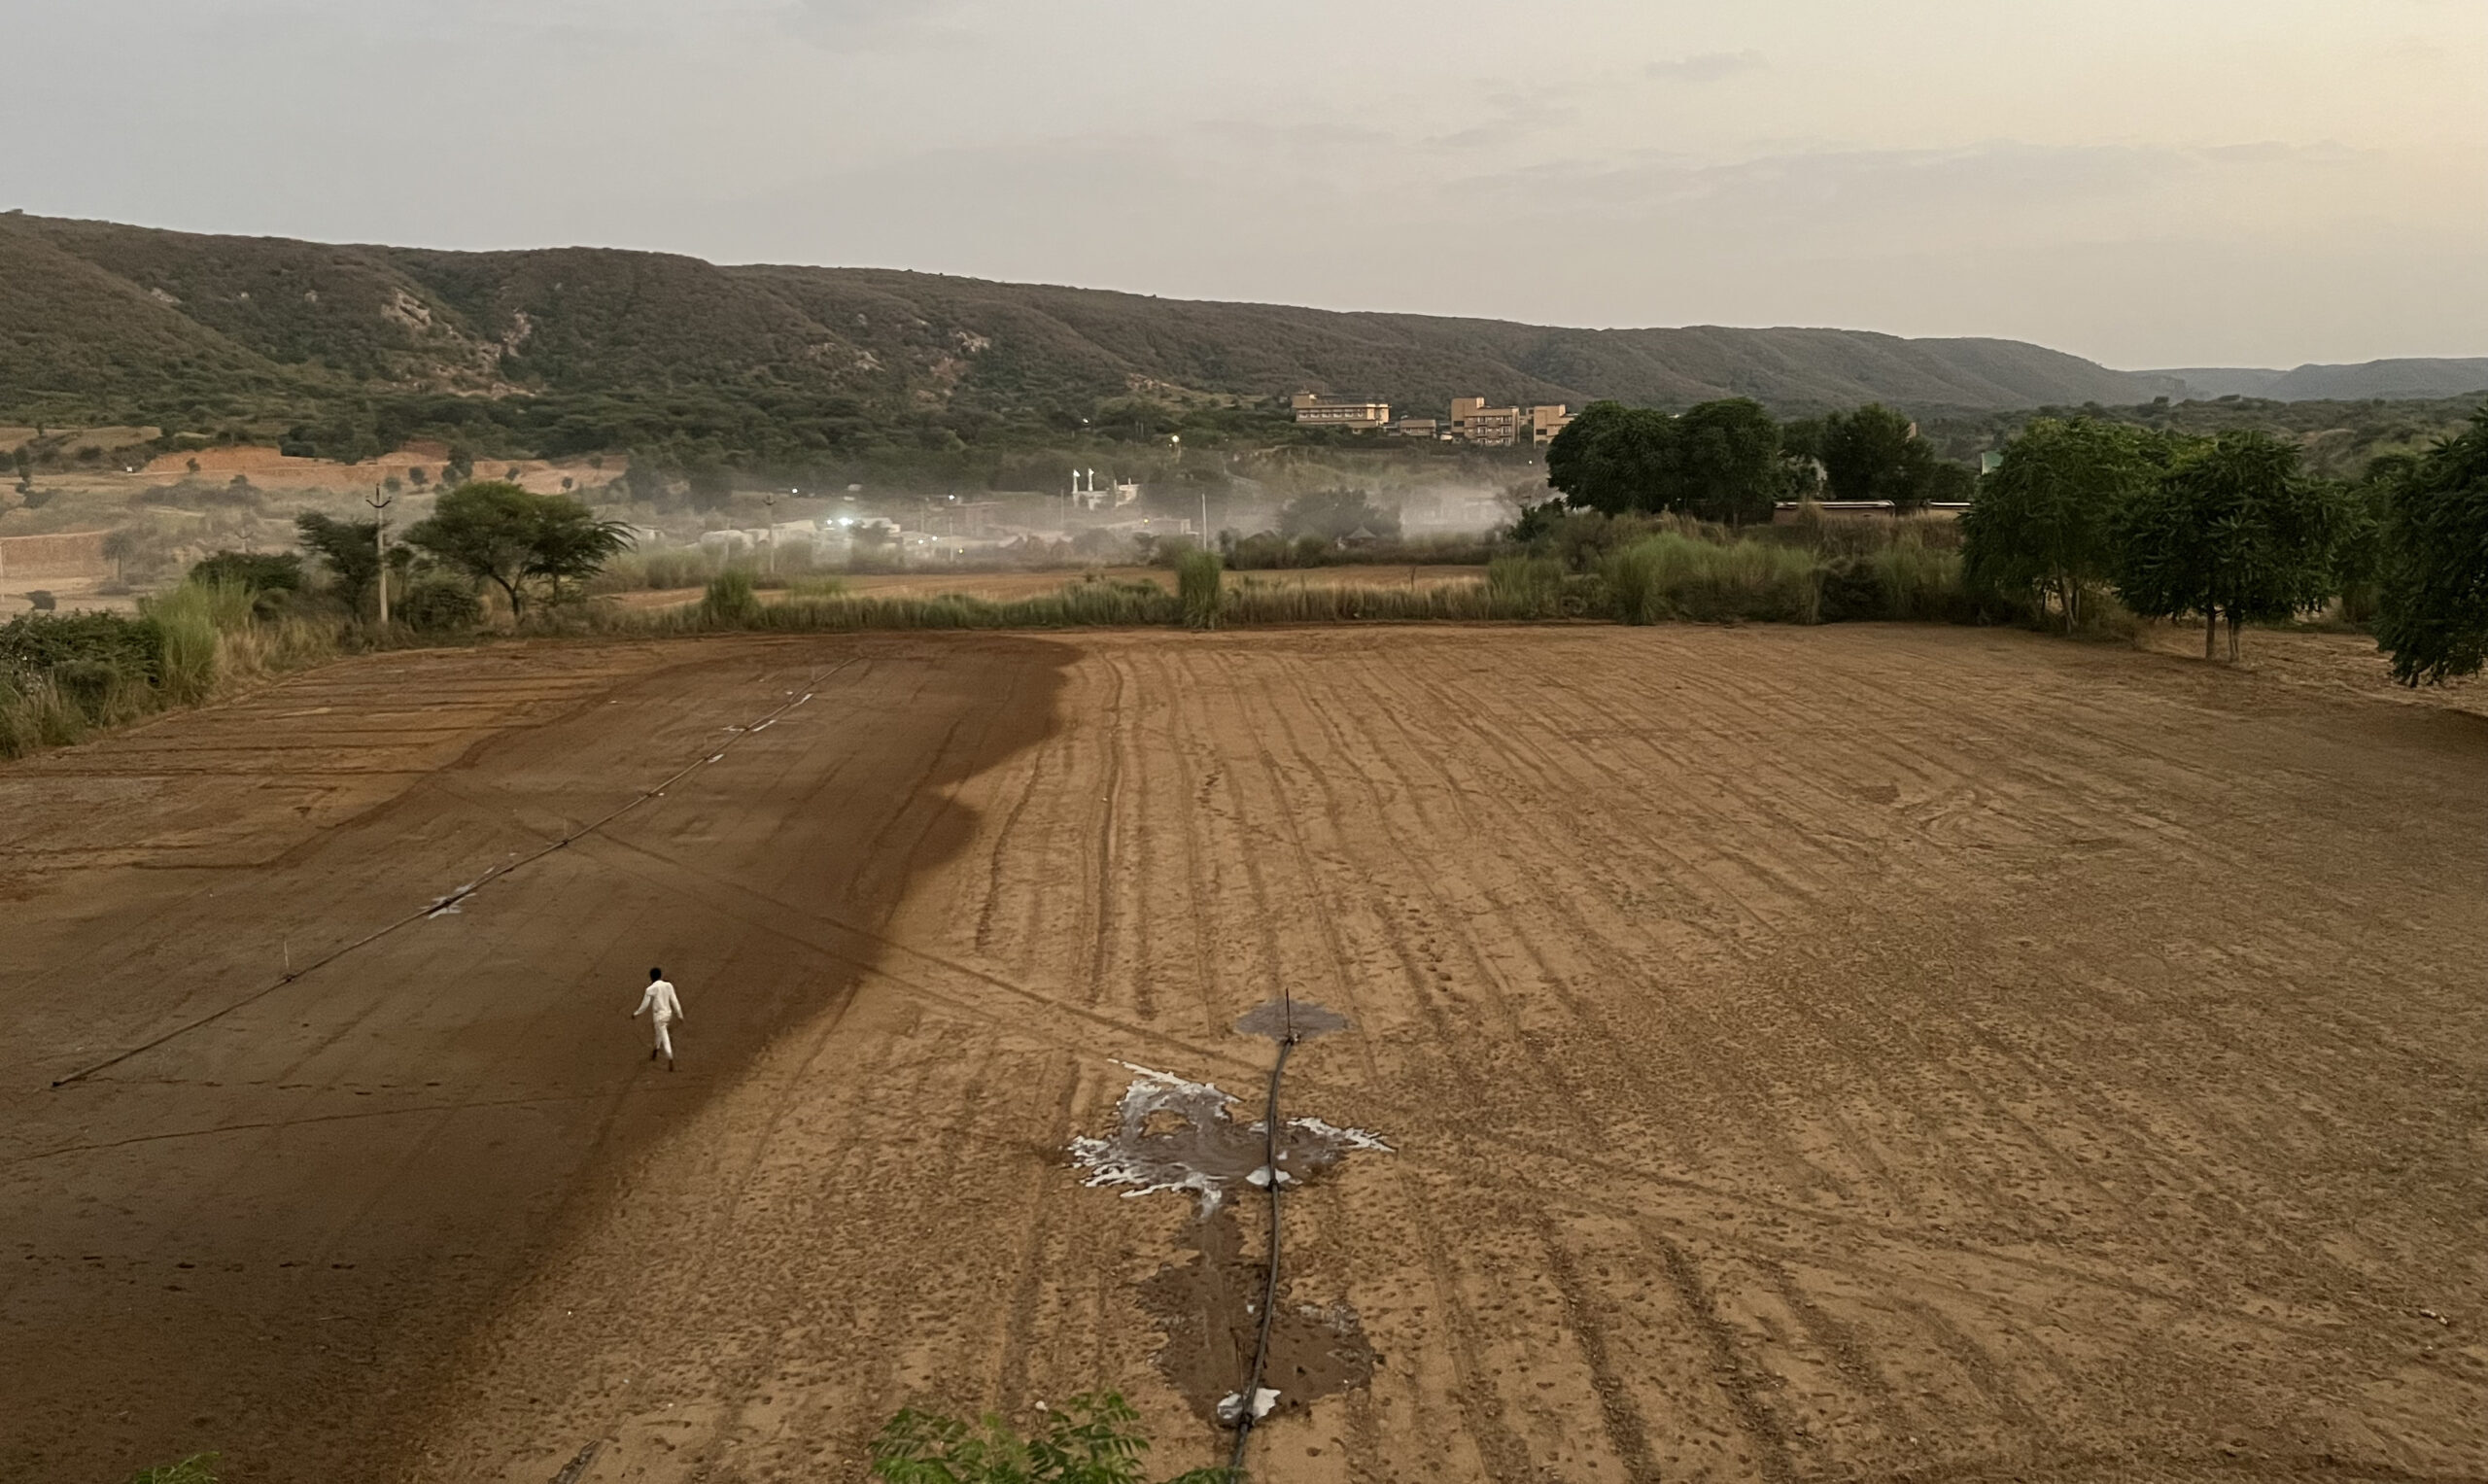
A view of a field in Neemli village, Rajasthan. Photo credit: WELL Labs
Watershed management projects are critical to securing the livelihoods for Indian farmers—a majority of whom own less than 2 hectares of land and are dependent on erratic rainfall for cultivation. While traditional top-down assessments often miss the nuance of micro-level interventions, grassroots organisations struggle to accurately measure impact as they contend with limited resources—small teams that manage multiple projects across difficult terrains.
Given the widespread use of watershed interventions across the sector, it’s essential to keep improving how we assess their impact. That’s why we’re shifting the lens towards a more cost-effective, participatory, and field-based approach to data collection. By pairing satellite data insights with local context, we believe impact assessment can become a powerful tool—not just for accountability, but for driving real change in rural water security and climate resilience.
Pivoting from secondary to contextual data
At WELL Labs, we are interested in exploring low-cost methods for hydrological impact assessment. We began our experiments a year back, in the arid state of Rajasthan, testing a method for the automated estimation of water storage potential in johads or percolation tanks. Commonly found across India (albeit with different local names), these structures harvest rainwater for groundwater replenishment.
We experimented with open-sourced Digital Elevation Models (DEMs) to quickly estimate storage potential and test scalability, with the goal of supporting low-budget civil society organisations with impact reporting. However, we soon realised the limitations associated with both the field context and the input data.
-
- Complex terrain: Percolation tanks are often constructed in hilly terrains, where the vertical accuracy of DEMs can pose challenges, even to arrive at rough estimates of water storage potential.
- Small structures: The volume of structures can vary and the smaller ones can go undetected in commonly available 30 m resolution DEMs.
- Change in natural elevation: The topography of the land is significantly altered when such structures are dug. However, most open-sourced products capture land surface only once, making them unreliable for impact assessment.
Water sector practitioners have long relied on secondary data, like district-level aquifer details from the Central Ground Water Board. However, such data is often sparse and not representative of local conditions. While useful for broad insights, more realistic estimates are needed for better planning.
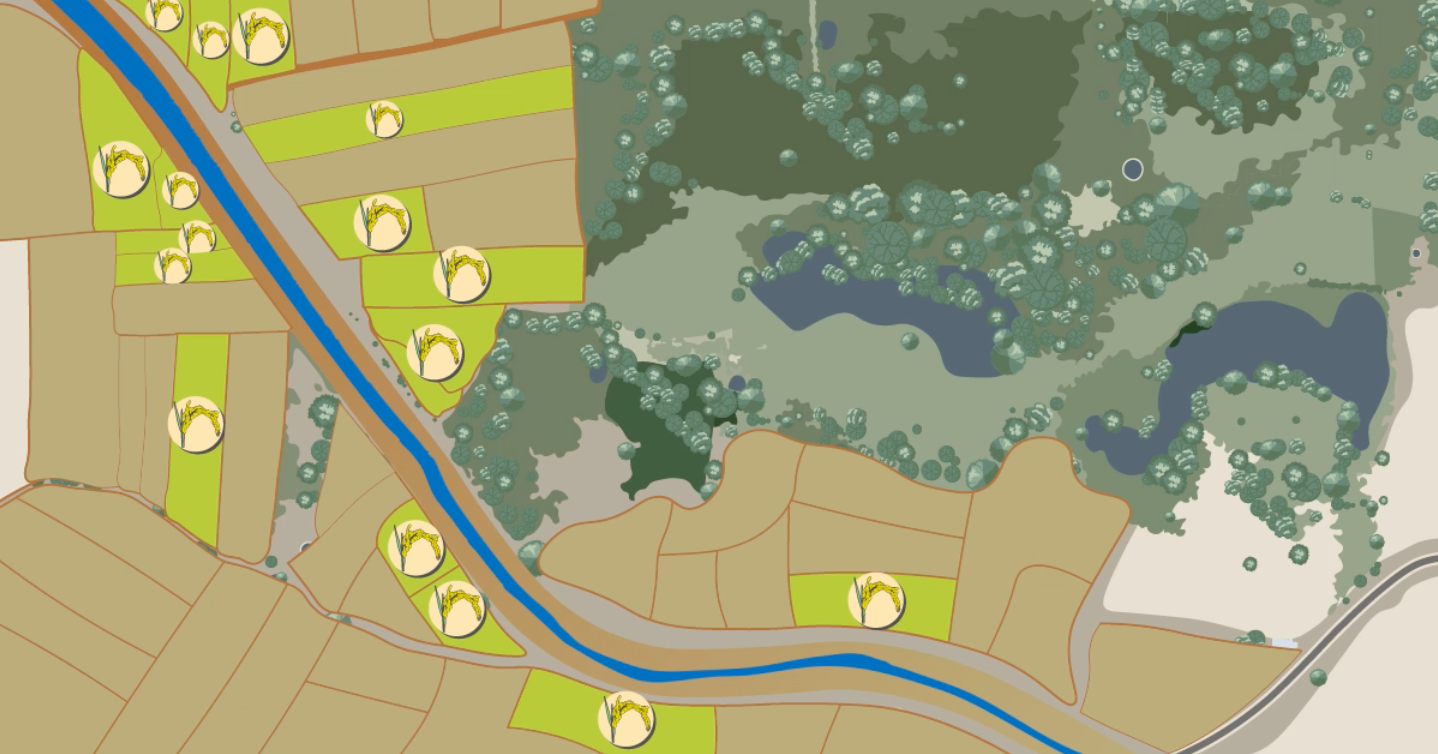
This is why we decided to pivot towards a participative, field data collection approach. Decentralised watershed management in India occurs at a micro-scale, with a series of interventions working in tandem. Looking from the skies to capture impact through satellites can prove useful only to a certain limit. This data needs to be complemented with contextual understanding of the region and data from the field.
Calculating water balance with the community
We began exploring a water balance-based method that is low-cost and requires participation from the beneficiaries of the water structures (Dashora et al. 2017). This simple tool uses a staff gauge, a rain gauge, and a quick water balance calculation to estimate the water recharge from a percolation tank.
Local community participation is crucial to this process. The beneficiary of the recharge structure needs to visit the site and capture readings on the staff gauge every day. Once the structure is empty (after monsoon), the observations can be collected and analysed by the local CSO to provide two kinds of information:
- Rate of groundwater recharge
- Number of times the structure fills during monsoon

An illustration of a staff gauge. Design credit: Aparna Nambiar
How was data collected?
We tested this method in Rajasthan’s Neemli village between June to September 2024 by installing three staff gauges on three johads, with the help of a local NGO called Tarun Bharat Sangh (TBS). Each newly-constructed johad was a different size—small, medium, and large. A TBS representative, who has been embedded in the community for more than three decades, recorded the structures’ water levels everyday using the staff gauge for four months. He also captured the daily rainfall data for the same duration as reflected on the manual rain gauge. During this period, the first filling in the structures took place on June 28, 2024, with rainfalls continuing till the end of September. The three johads were nearly empty after mid-October.
These observations were then fed to the following water balance equation to estimate the recharge rate. To eliminate uncertainty about estimating runoff, observations were chosen for days when there was no rainfall, giving dry weather infiltration rate.
| (Change in height of water level in one day) ΔH (mm/day) = Runoff (mm/day) + Recharge (mm/day) + Evaporation loss (mm/day) |
The evaporation rate can be taken from the nearest weather station or remote sensing data.
What does the data tell us?
Patterns observed from the daily data give us insights into the characteristics of the storage structure, the catchment properties, and subsurface hydrogeology.

Johad 1: Soth ka Bandh is a medium-sized structure that underwent three large fillings and three minor fillings in the entire season. The median infiltration rate recorded here was 45 mm/day.
.
Our observations showed that:
- Each curve response is unique to the size of the structure, its shape and the catchment area. When it comes to small structures, even small rainfall events quickly fill up the storage. Large structures only respond to large rainfall events and automatically cater to large upstream catchments.
- Newly-constructed recharge structures demonstrate a high rate of infiltration. The accumulation of silt over time tends to lower infiltration rates due to its water retention and compaction properties.
- Groundwater and surface water connection reduces recharge. There were instances when water levels didn’t decline beyond a certain mark, indicating that the groundwater table had risen and connected with the surface water. This equilibrium prevents further recharge, as no additional water can be absorbed into the ground.
The performance of such structures depends on soil characteristics, aquifer capacity, and local climatic conditions. The table below summarises our observations of the three johads:
| Percolation tank | Structure size | Number of fillings | Recharge rate |
| Johad 1 | Medium | 6 | 45 mm/day |
| Johad 2 | Large | 3 | 62 mm/day |
| Johad 3 | Small | 6 | 65 mm/day |

Johad 2: Ramsagar Bandh is a large structure that received three major fillings during monsoon and recorded an infiltration rate of 62 mm/day.

Johad 3: Gwal vala Bandh is a small structure that saw a series of quick recharge and discharge instances during monsoon.
The infiltration rate was a median rate of 65 mm/day.
This simple, low-cost method helps improve understanding of how effectively a percolation tank recharges groundwater.
|
|
|
|
For more details on how to calculate recharge using this water balance method, read our staff gauge toolbox.
Acknowledgements
This work was done in collaboration with Tarun Bharat Sangh.
Edited by Ananya Revanna
If you would like to collaborate, write to us. We would love to hear from you.
Follow us and stay updated about our work:
Related Posts
-
Field Notes from Jharkhand: Testing Jaltol on The Ground With WASSAN
By collating secondary data and allowing for grassroots communities to input specific primary data, Jaltol can address the data and technical gap that impairs water budgeting and rural water planning.
-
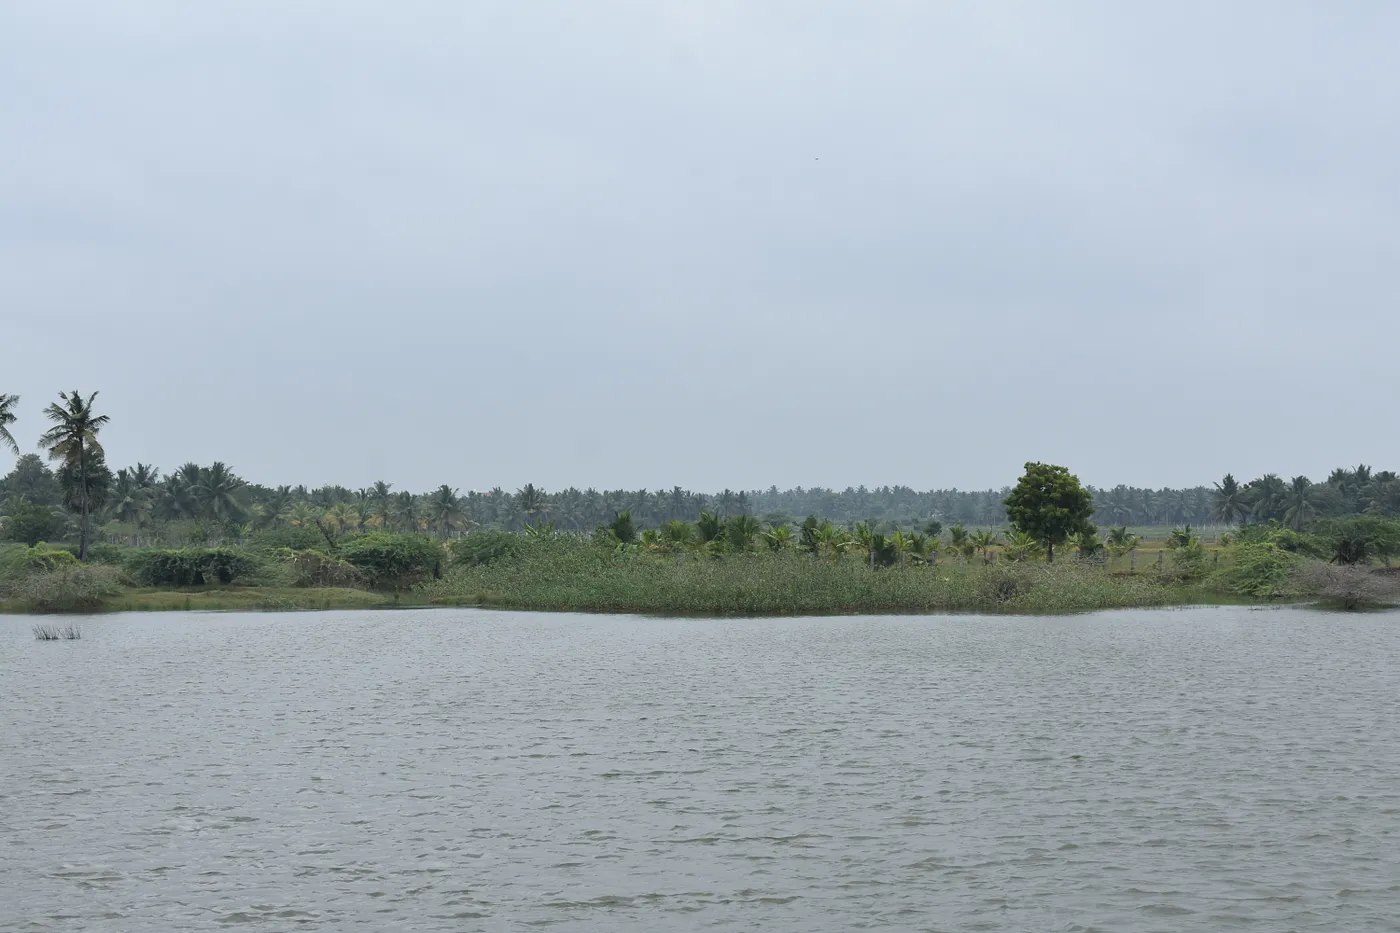
Drinking Water for Every Rural Household: A Tamil Nadu Village Highlights Challenges
We visited Nadiyam, a coastal village in Tamil Nadu, to examine water supply under the Jal Jeevan Mission and the challenges in sustaining piped drinking water access in rural areas
-
Rural Water Security: How Our Vision for Jaltol Has Progressed
WELL Labs is co-developing with its partners simple user-friendly tools, under the Jaltol framework, to help us diagnose the magnitude of water mismanagement and track our progress towards water se...
-
How Often are India’s Farming Patterns Changing? With IIT Delhi, We Turn to New Land Use Maps for Answers
Remote sensing data validated through reports from the ground can capture changes in spatial agricultural patterns down to plot level. This blog sheds light on land use maps developed by IIT Delhi ...
-
Remote Sensing in Rajasthan: Can Jaltol Buttress Traditional Johads?
We team up with Tarun Bharat Sangh to see how remote sensing can aid planning, impact evaluation and scaling up for johads, the traditional earthen embankments that are key to water conservation ef...
-
WELL Labs Partners with IHE Delft, ACIWRM to Develop Community-Driven Data Solutions
WELL Labs has partnered with ACIWRM and IHE Delft to understand and improve community-driven applications of remote sensing data in India’s Krishna river basin.