Jaltol and Johads: Tracking the Impact of Watershed Management in Rajasthan
Sign up for our Data for Water Security Hackathon on 7 March 2024. Participants will use curated datasets available on Jaltol, an open source data analytics tool, to solve critical questions on water security.
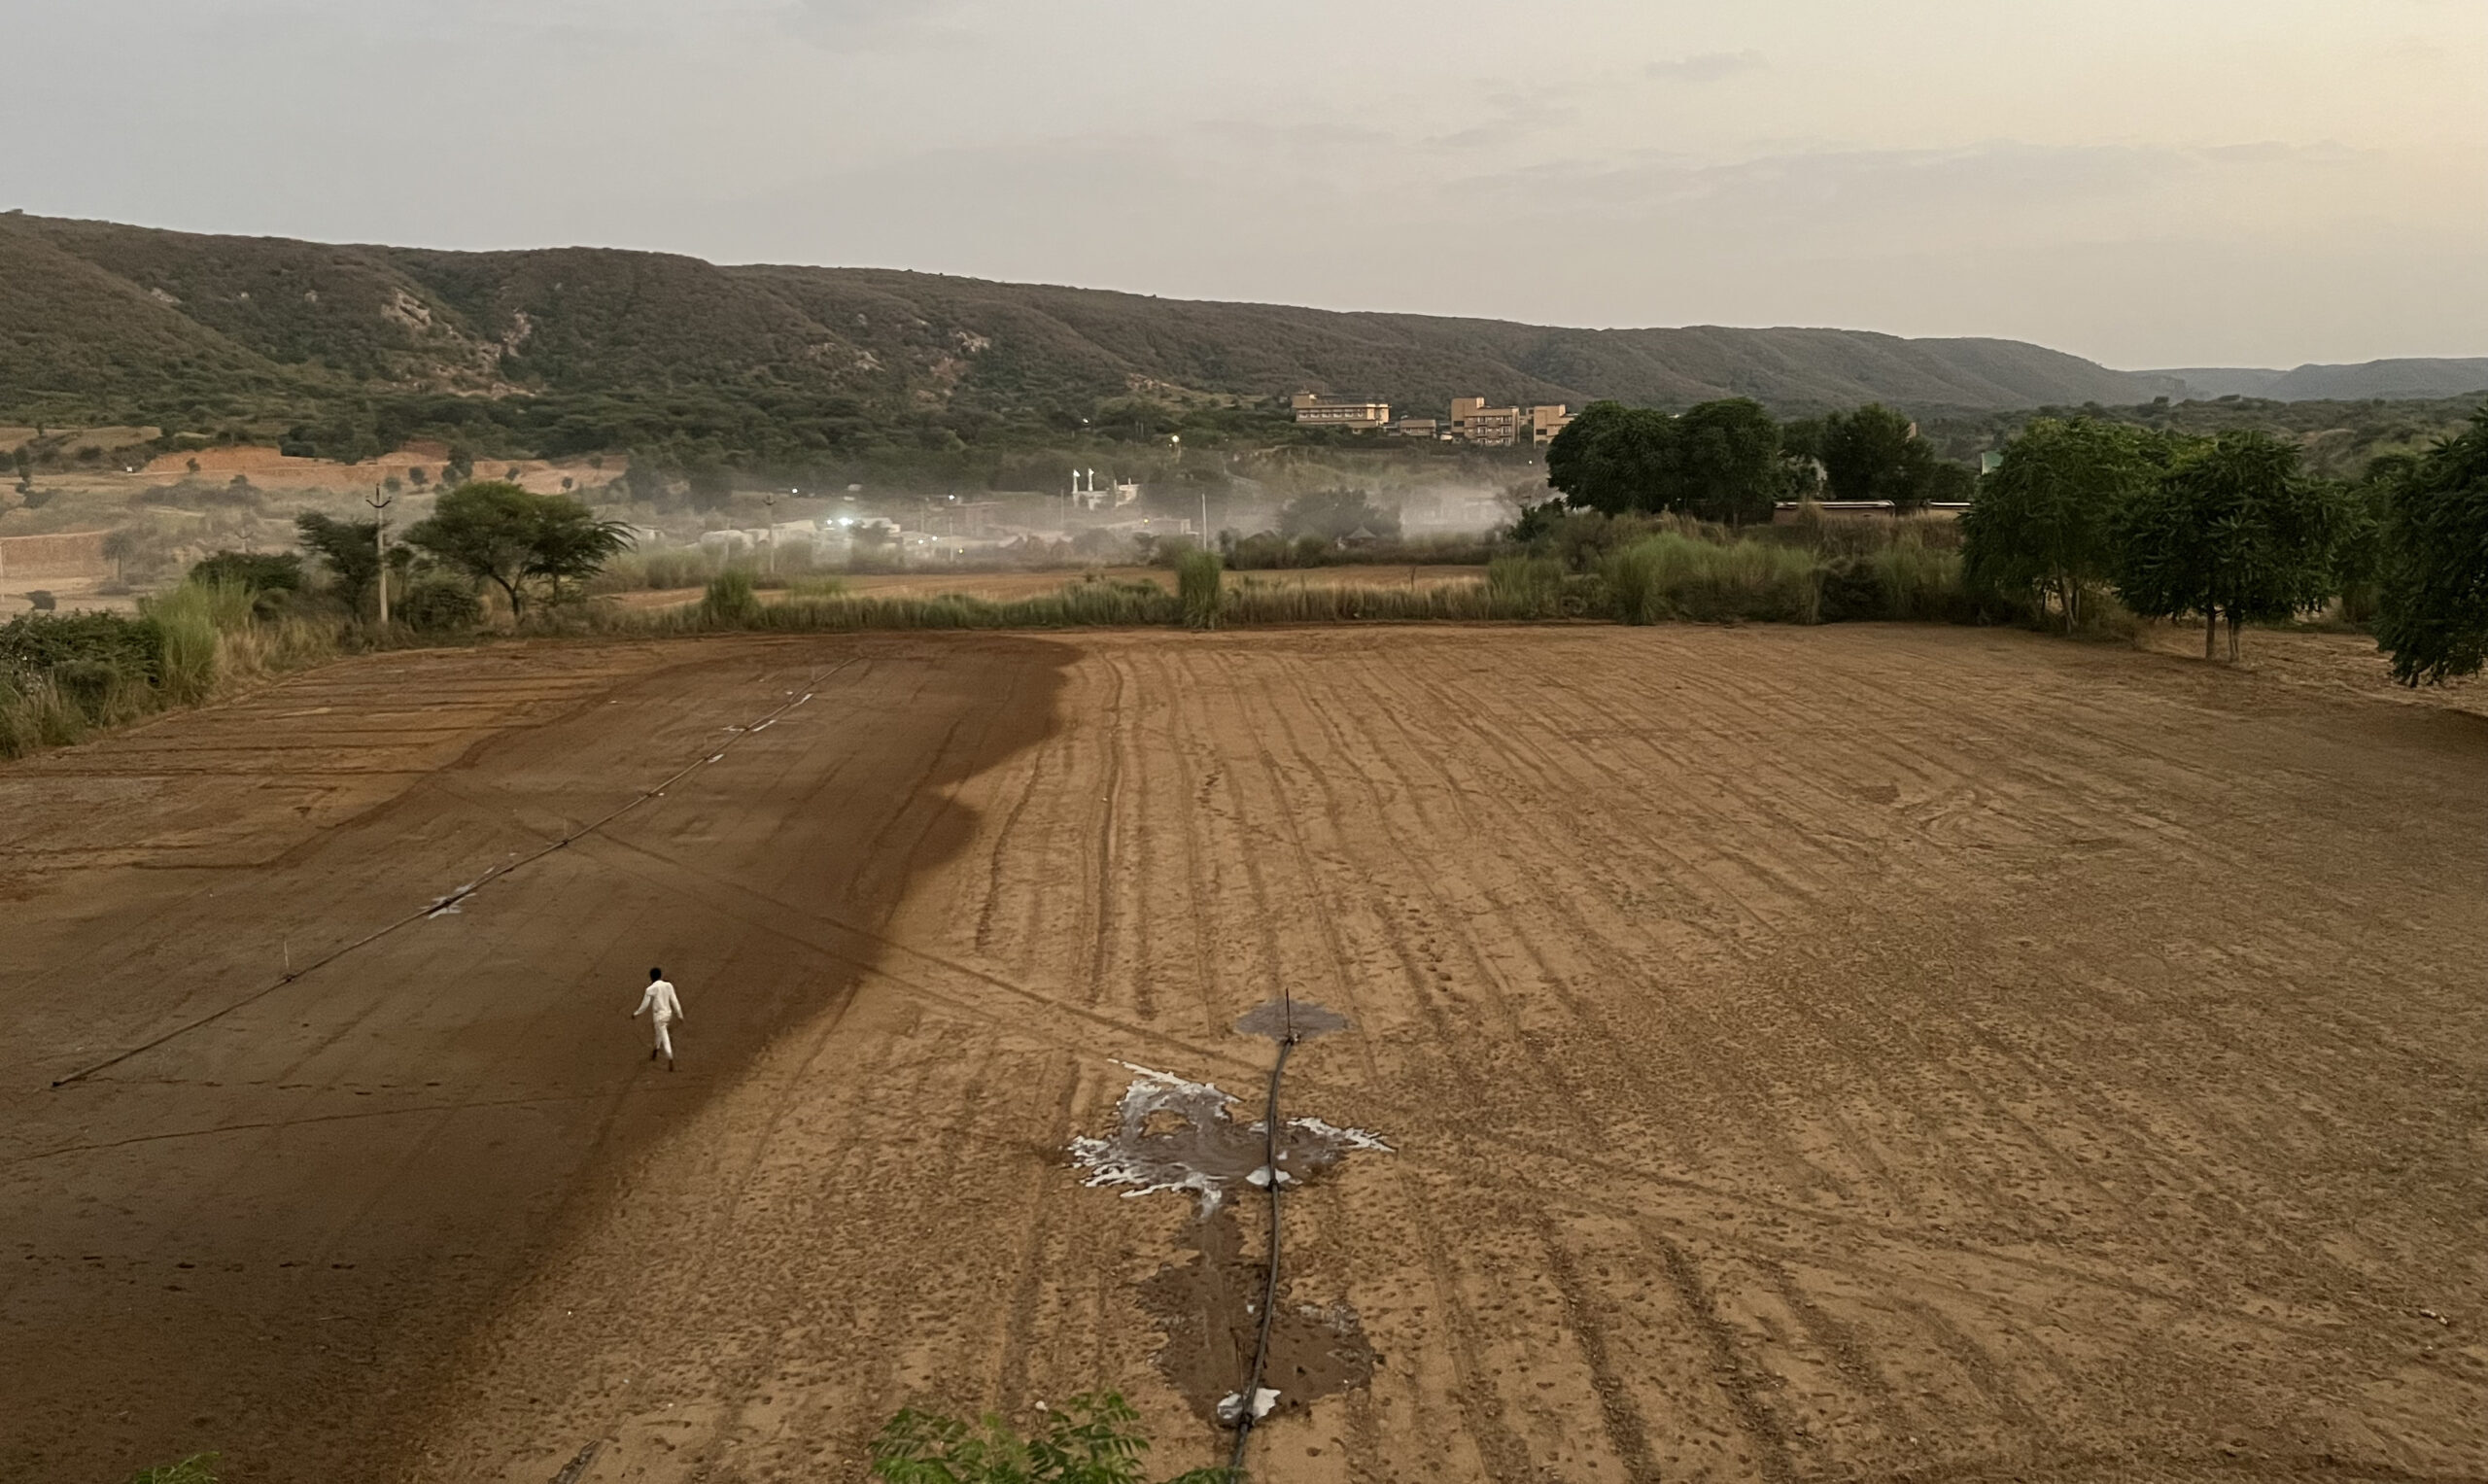
Tarun Bharat Sangh (TBS) is a decades-old NGO that has been working to address water insecurity in hot and dry Rajasthan. The state gets an average of 400 mm of rainfall per year, which is too low to sustain entirely farm-based livelihoods. But this organisation had a formula they believed would change the parched landscapes here for the better — building traditional check dams or johads.
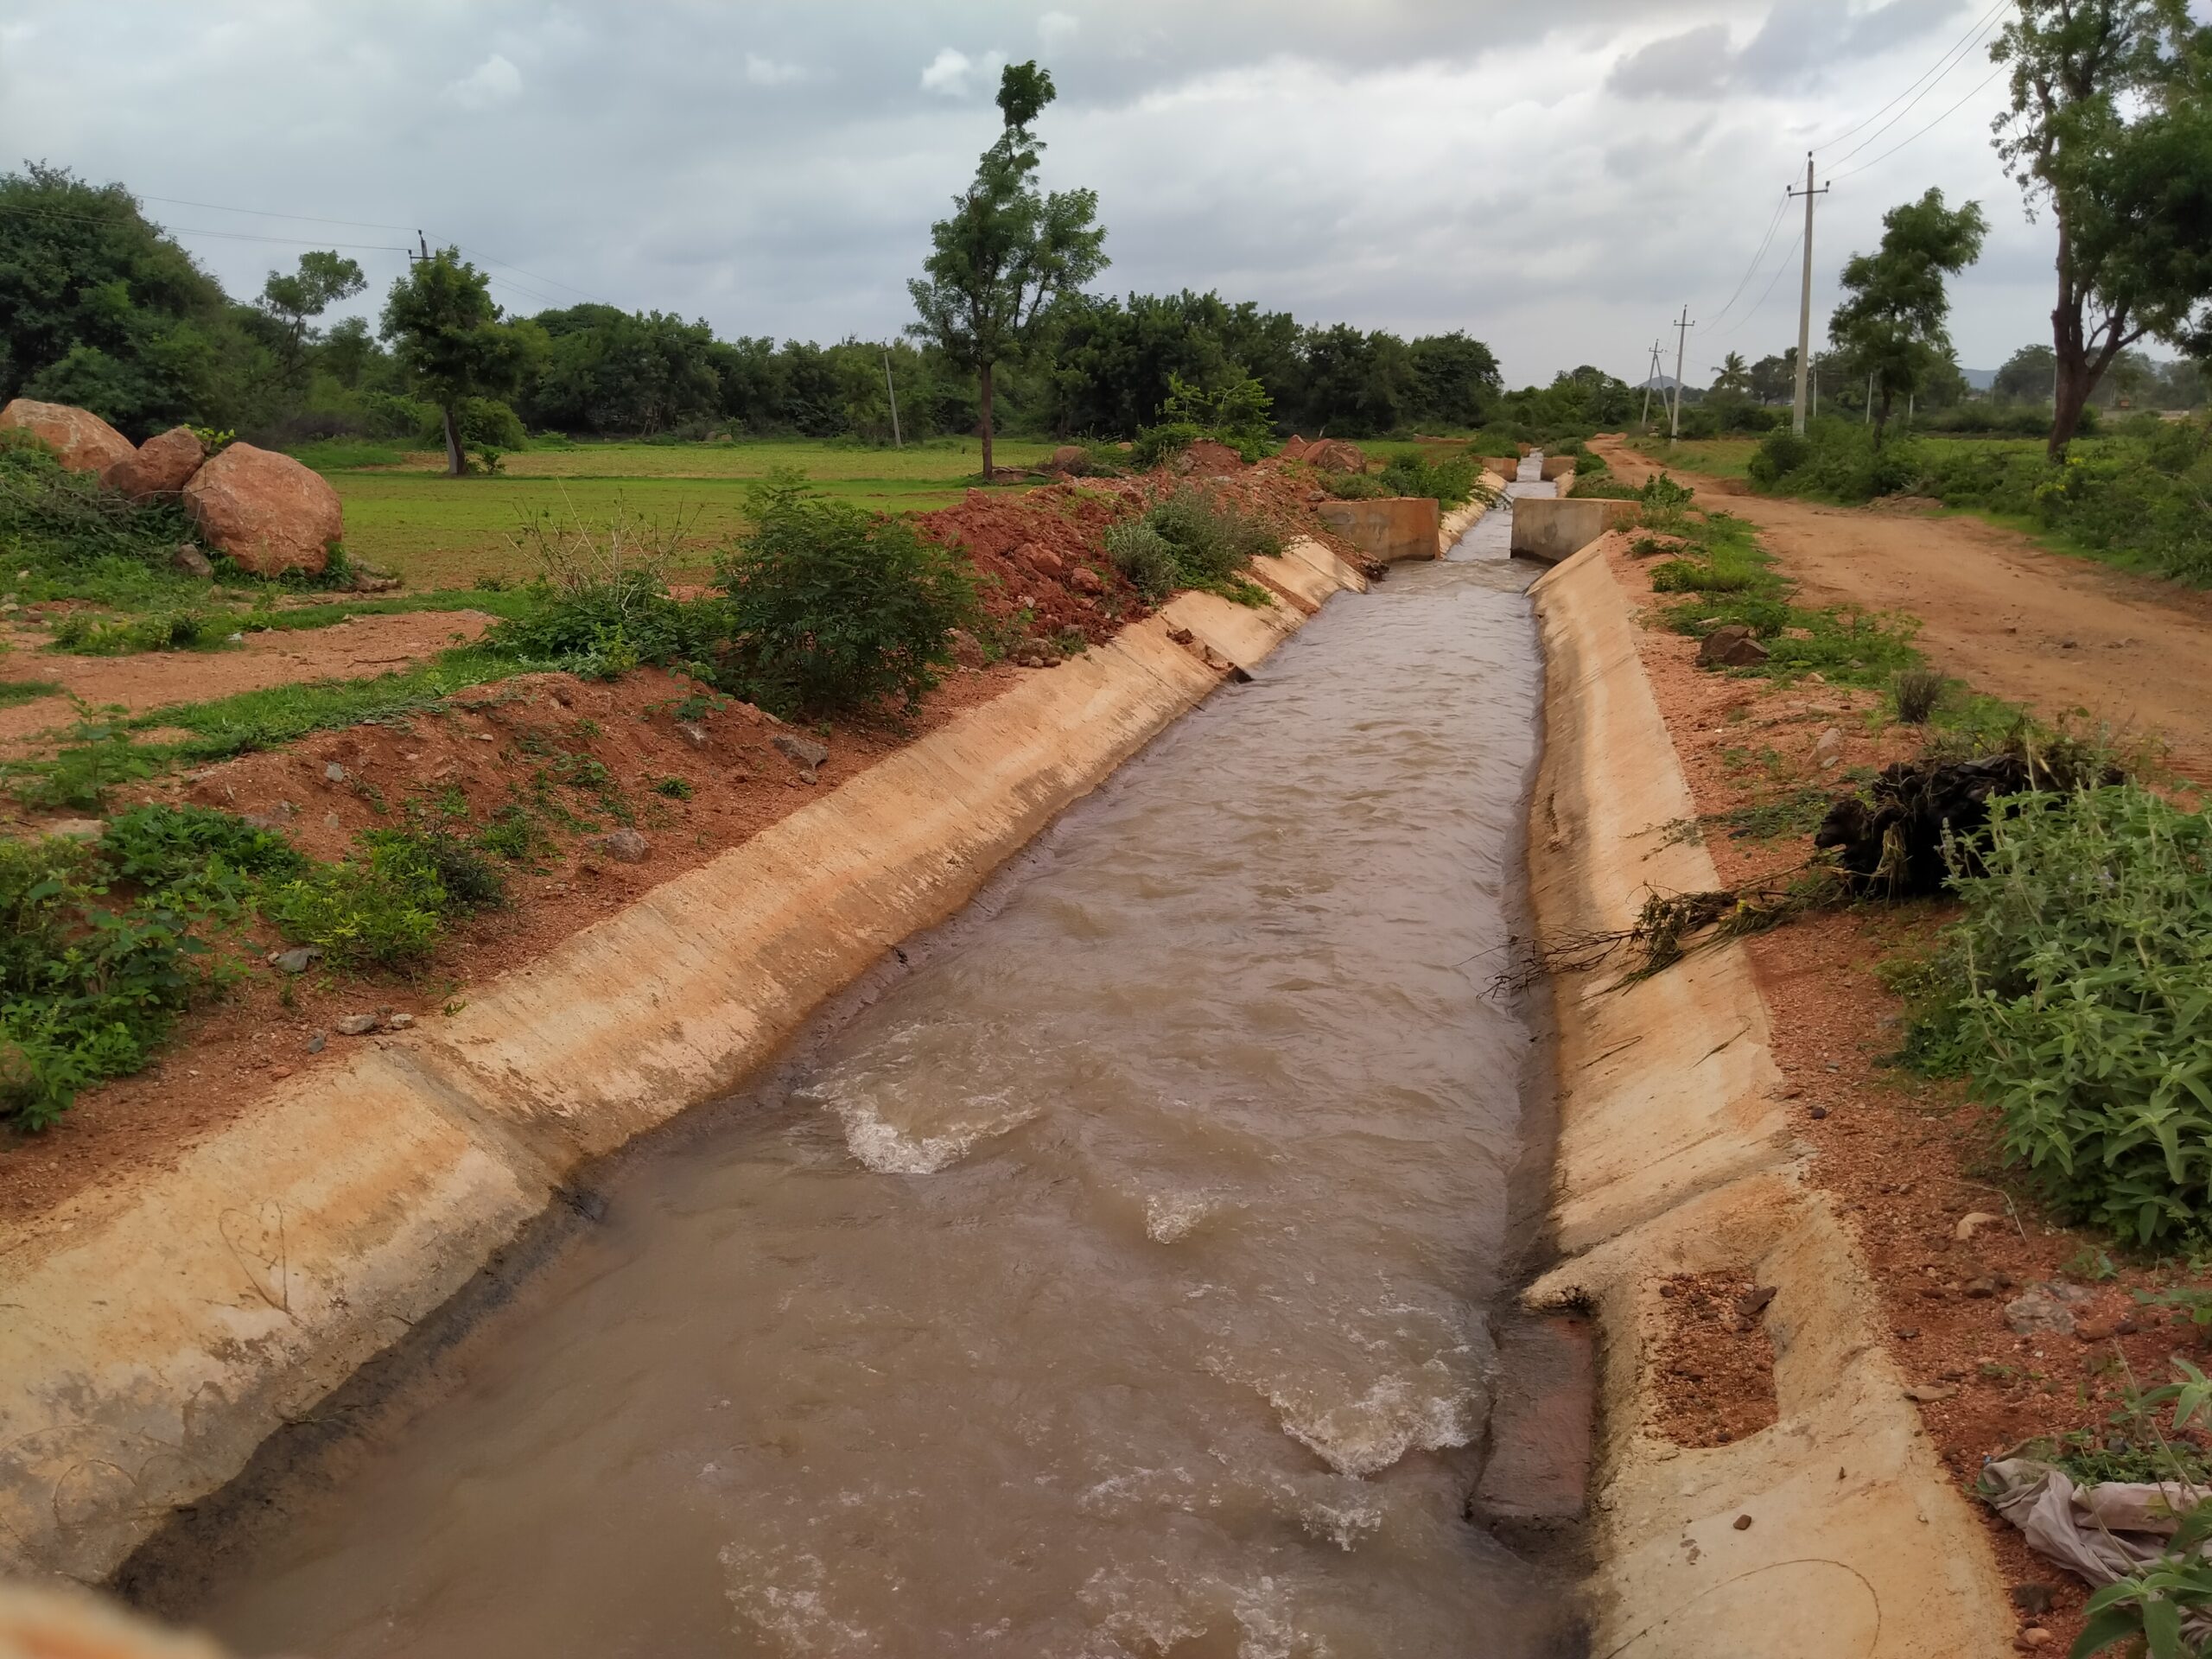
These low earthen embankments capture rainfall runoff, form ponds that store water for longer periods, allowing recharge of aquifers. More groundwater availability is expected to improve cropping intensity. This would mean farmers could adopt more than one crop in a year other than the rainfed (kharif season) crop. These check dams also rejuvenate rivers in the vicinity because groundwater recharge yields water to rivers long after the monsoon season. This formula has been templatised and has allowed TBS to construct more than 13,000 structures since their inception in the 1980s.
In the district of Karauli in the north-eastern part of Rajasthan, TBS has been building rainwater harvesting structures since 2015. There is much anecdotal evidence that these structures have resulted in benefits to communities downstream. However, given the scale of their operations, it is difficult for TBS to systematically monitor and report on outcomes for all of its structural interventions.
WELL Labs has been working with TBS to address this problem.
Remote sensing data offers the opportunity to monitor impact systematically. In this post, we describe a methodology for such a monitoring study and the results we see. If it proves to be useful, such a study could be productised within Jaltol, an open source data analytics tool we developed, so that it could be easily reproduced year after year.
Read | Remote Sensing in Rajasthan: Can Jaltol Buttress Traditional Johads?
We first identify our primary outcome indicator. This, we decided, is the change in cropping intensity, which means the number of crops a farmer is able to cultivate on the same plot of land over the span of a year. Since we needed to understand whether farmers are able to double crop, i.e. farm in the winter rabi season as well, we needed to quantify the estimated area under cropping in each downstream village specifically during rabi over a few years pre and post intervention. However, there are many confounding factors to account for. We can’t simply look at how a single structure has impacted the downstream agricultural land. We must identify a similar village where no structure was built and compare the impact in both villages.
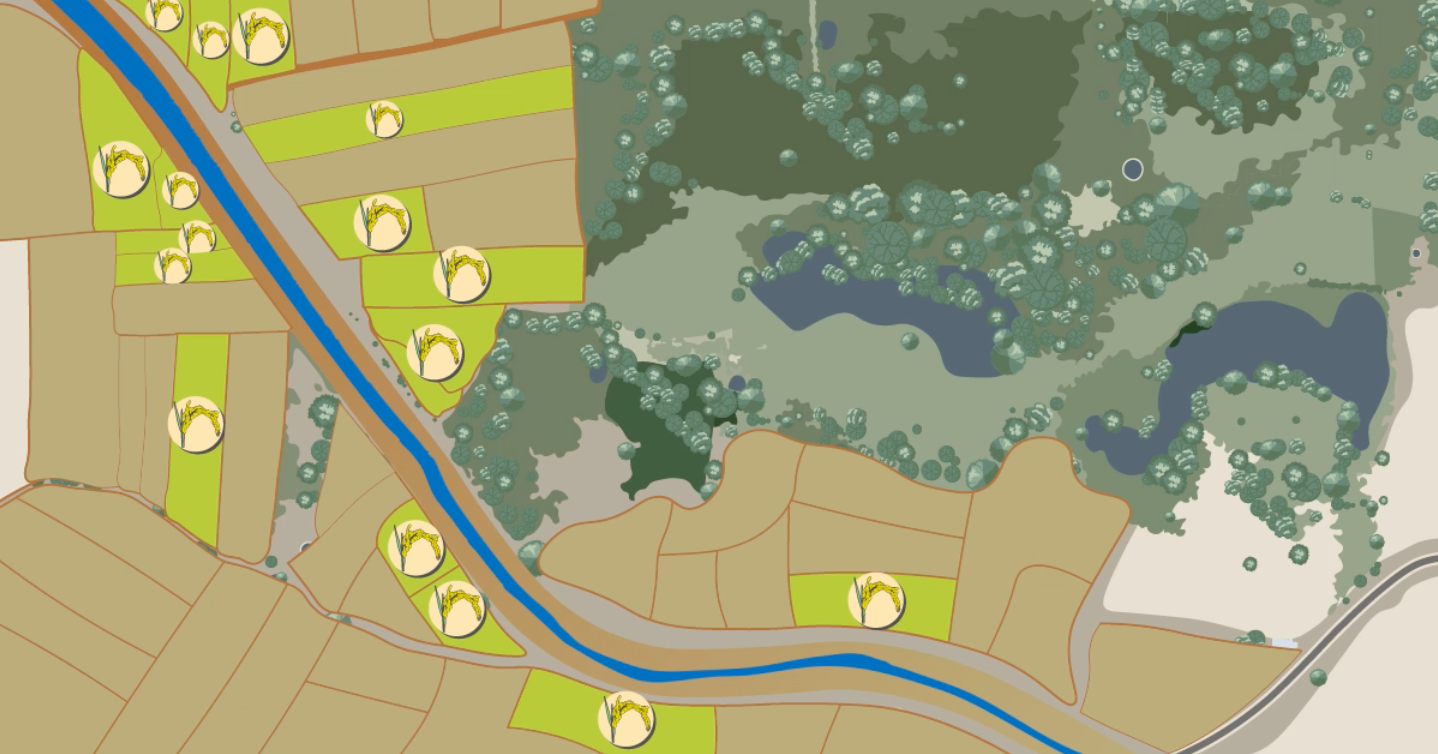
Remote sensing data allows us to do this. As we see in the first and second image below, we isolate villages in clusters of lower and higher slopes, and then demarcate agricultural land within these villages to identify areas for study. The black dots indicate the presence of constructed structures and their corresponding sphere of influence. The green, yellow and red denote the slopes, which indicate how much water could be potentially captured and stored. This helps us identify villages with similar terrain.

Figure 1: Slope of the land in the vicinity of constructed structures (shown as black dots). Green (0-2%), Yellow (2-4%), Red (4-6%) (Source: FABDEM)

Figure 2: Agricultural land (in orange) within the same buffer of constructed structures (which are likely to benefit from constructed structures) (Source: Dynamic World + FABDEM)
If the structures being compared are sufficiently proximate to each other, rainfall as a confounding factor can be neglected since the two are likely to have received similar amounts of rainfall over the years.
We can now examine changes in cropping intensity over the years within these agricultural lands. These charts might look something like the one below. The dark line shows agricultural land where cropping intensity has shown a marked increase post 2015-17 – the years when the check dam was constructed – and the blue line shows land where cropping intensity has shown no marked increase post 2015 (in this case, the structure was constructed but it led to no significant change, pointing to other factors at play that affect groundwater recharge and the expansion of farming).
These charts support anecdotal evidence from the field, which suggest that the local aquifer received enough recharge for farmers to have increased access to groundwater, enabling them to cultivate a second crop.

The dark line denotes the Babu Singh Ki Pokher johad, which shows agricultural land where cropping intensity has shown a marked increase since 2015. The lighter blue line shows land where cropping intensity has shown no strong trend despite the intervention.
Needless to say, this is meant to serve as a simple example of an analysis. It isn’t rigorous enough to prove that the impact can be attributed only to the intervention. This requires a stronger case study with a larger area taken under examination. The deeper examination will likely show that in certain cases, success was phenomenal, larger than expected. In other cases, success didn’t pan out as hoped for. Either way, TBS could benefit from these findings because they provide clues and lessons that could help improve the effectiveness of their programme.
We hope to further develop such use cases, perhaps impact assessments, or problem diagnosis use cases using remote sensing data. Once methodologies are well established, we hope to develop these into simple features within Jaltol. We invite you to submit your ideas for the same!
Our Jaltol team is co-hosting the ‘Data for Water Security Hackathon’ on 7 March, from 10 am to 6 pm, to help solve complex challenges pertaining to agriculture, water and livelihoods across India through data gathering and analysis.
Participants will be required to use curated datasets available on Jaltol, an open source data analytics tool, to solve critical questions on water security. Through this hackathon, we seek to foster collaboration between grassroots organisations, students and researchers.
Register here: https://bit.ly/JaltolHackathon
If you would like to collaborate, write to us. We would love to hear from you.
Follow us and stay updated about our work:

Related Posts
Related Posts
-
Field Notes from Jharkhand: Testing Jaltol on The Ground With WASSAN
By collating secondary data and allowing for grassroots communities to input specific primary data, Jaltol can address the data and technical gap that impairs water budgeting and rural water planning.
-
Drinking Water for Every Rural Household: A Tamil Nadu Village Highlights Challenges
We visited Nadiyam, a coastal village in Tamil Nadu, to examine water supply under the Jal Jeevan Mission and the challenges in sustaining piped drinking water access in rural areas
-
Rural Water Security: How Our Vision for Jaltol Has Progressed
WELL Labs is co-developing with its partners simple user-friendly tools, under the Jaltol framework, to help us diagnose the magnitude of water mismanagement and track our progress towards water se...
-
How Often are India’s Farming Patterns Changing? With IIT Delhi, We Turn to New Land Use Maps for Answers
Remote sensing data validated through reports from the ground can capture changes in spatial agricultural patterns down to plot level. This blog sheds light on land use maps developed by IIT Delhi ...
-
Remote Sensing in Rajasthan: Can Jaltol Buttress Traditional Johads?
We team up with Tarun Bharat Sangh to see how remote sensing can aid planning, impact evaluation and scaling up for johads, the traditional earthen embankments that are key to water conservation ef...
-
WELL Labs Partners with IHE Delft, ACIWRM to Develop Community-Driven Data Solutions
WELL Labs has partnered with ACIWRM and IHE Delft to understand and improve community-driven applications of remote sensing data in India’s Krishna river basin.